Formative Data to drive Instruction |
Early and Often is key to making sure that students make progress throughout the year and show growth. To ensure this I use formative data as well as summative data to drive my instruction. I have found that using Student Led Workshops is a great way to see if students truly understand the content and what they struggle with most of all.
I implement Lexia everyday and check for completion, to assist with Personalized Learning. Here I am able to see their levels and progess. Students complete their requiered amount of time each week and focus on the number of units gained. I use incentives and Friday interventions to insure minutes are met each week. I use a data tracker so students are able to reflect on the amount of units are gained each week and if they are able to complete thier minutes. I am able to use the lessons provided to help persoanlize instruction during tutorials or small gorup.
- Individual Presentations/Projects is also another way I can see if students are truly understanding standards on the application level. For example I have had students analyze commercials and present their findings to the class. Students had to explain what technique was used and how it was used. From these presentations I found that some students needed additional instruction how the technique was being used in the advertisements.
Persuasive Technique Project: https://docs.google.com/presentation/d/1rnkGvRKjn-fAMcRVBEhQ1mW8U_7SdobAvSK501hvvzI/edit?usp=sharing
Student Led Workshops: For several different standards groups are given a standard and are in charge of researching and becoming experts over that standard. They are required to give some kind of presentation that defines the standard and gives examples over the standard. They create a notes for classmates to copy into their interactive notebooks. The group then is in charge of creating some kind of formative assessment for classmates to participate in to assess whether or not they understood what was taught.
Geography Student workshops
https://docs.google.com/presentation/d/1BJPi2UtVFlMyIwlcgRvHeWaCnPhndTIqe-Vt0m8fezw/edit?usp=sharing
https://docs.google.com/presentation/d/1mQbvGrNiymFP_zwLb_wnuthuj2-VOGd1sdIjbyYFbQU/edit?usp=sharing
Paired Student Formative student Workshops to present to class.
IXL formative assessment of mastery of content.
Individualized Pathways with ending projects
Station specific lessons based on current skills we are utilizing.
Artifacts of Station based practices
Student Artifacts as Evidence |
Data recieved from 6th Grade CDA and Benchmark 1 showsed that students were struggling with Informational Text. Students analyzed data using trackers showing low skills on both Tests. Students found their 6 lowest TEKS. With this they used a Choice Board that I created that gave them bleneded learning lessons and practice over these speciific TEKS. Studnets could also choose other TEKS they feel was were they struggled the most to get the extra practice. Below is a link to an example of one of the Data trackers and the Choice Board
Personalized Benchmark Choice Board
Other ways to help student progress with struggling TEKS is to create PBL projects that emphasize application of those struggling skills. With the knowledge I gained from the data on Benchmarks and CDAs I also created a PBL that focuses on text structures and authors purpose. I tweaked a previously taught PBL to focus on those specific Reading Skills while they learn about their Social Studies TEKS that need to be taught. I found that with new schedule it was hard to put all the peices my classroom consists of into an hour especially teaching two subjects, so utilizing the time by teaching content with the cross curricular mindset was definitly best practice. Below is the PBL that tied it all together.
Caldwell ZOO PBL
I used this PBL as a way to review some nonfiction TEKS that some students seemed to struggle with. I also was able to incorporate Argumentative Text in it as well by having student implement rhetorical devices and logical fallacies through their advertisments and essays. This PBL was a fantastic way to keep students engaged and learning through Cross Curriclar lens of Social Studies, Science and ELA. Students had a blast researching their animals, plants and landorms. They were able to apply their reserach knowledge into a creation of an exhibit. They build a model, research slides and an advertisment showing why their exhibit was the best addition to the Caldwell Zoo.
2019/2020 - According to Reading Third Grade Benchmarks students were struggling with inferencing and comparing and constrast fiction and nonfiction text. Students were given a Fictional Story "I need my Monster" and then were to ceate a Google Slide creating a nonfiction text over real animals or myths taht are considered "monsters." Once students did the research they created STAAR Stemmed fiction and nonfiction questions. This helped prepare them for STAAR by familiarizing themselves with the types of questions that they will see and have a deeper understanding of them.
2018/2019 - According to Benchmark data for 4th grade Writing, the composition section of the test was where my 4th graders struggled a lot. These students participated in the Student Writing Portfolio Project called The Youth's Writers Showcase and Social. During this project students created 3 compositions extending their knowledge of Expository compositions through mini-workshops on thesis statements, introductions, proper body paragraph development, conclusions, and writing meaningful examples,. Students upgraded their skills as a writer. Students paired with older students in both 6th and 7th grade to peer review and discuss ways to improve their compositions. They also practiced analyzing their writing using a student friendly rubric. Students presented their work and showcased their learning at the end of the PBL to an audience reading their favorite composition and their reflection of their strengths, weaknesses and improvements during the PBL. Students then participated in the Social with their parents, enjoyed refreshments and talked about their other compositions that were showcased.
Entry Doc: Writers' Conference Entry Doc..docx Rubric: Expository Writing Student Rubric.pdf
Products: https://drive.google.com/file/d/16_OeclvzCFjr6sCBqix8khCgwUI6hRWg/view?usp=sharing
https://drive.google.com/file/d/1ef9gXyztsVc2dzcUex9MV2WmB2h4AuPf/view?usp=sharing
https://drive.google.com/file/d/1Y6Vrxk6CGqWMCouG-zGxHF6OpiiNcyg6/view?usp=sharing
Reflection Letter: Aubrey Burnett Reflection Writing PBL.docx
Expository Composition: https://docs.google.com/document/d/1hJ92PbCdc459sd8Psp_Q8bR6y9oZ_peYxNegHU5rjwk/edit?usp=sharing
2017/2018 - Quarter 3
According the 4th grade Writing Benchmark 1 and 2 students struggled with the Expository Composition section of the Benchmark. To focus and improve these standards and skills I implemented a Student Writing Portfolio Project. The Youth's writers showcase and Social PBL aided students knowledge of Expository compositions through mini-workshops on thesis statements, introductions, proper body paragraph development, conclusions, and writing meaningful examples,. Students upgraded their skills as a writer. They used a variety of texts throughout the conference to use as tools for developing more detailed body paragraphs that related to the prompt in a unique and meaningful way. Students presented their work and showcased their learning at the end of the PBL to an audience. I felt like this was a successful tactic and have seem growth with in the students writing.
Entry Doc. Writers' Conference Entry Doc..docx
Products. https://drive.google.com/file/d/1UwAQAphViJozsB2tr1xDRnIX5jw65dtH/view?usp=sharing
https://drive.google.com/file/d/1JDuG_1vXoHLlORM-VPvIsxGwI09KIx_z/view?usp=sharing
2016/2017- Quarter 2
According to 5th grade Reading Benchmark 1, students struggle with text features and text structures. Students organized informative text using a variety of text structures and features in their informative brochures given out at their Gallery Walk Presentations.
5th Invasive Species RUBRIC2016.docx
Invasive Species PBL Product.pdf
Reading Data and Progress Measure to evaluate learning |
READING Leveling: One tool I use is leveling students reading progress from the beginning of the year to the End of the year using DRA . I have had many of the students for the past two years, so I add on to the document to make sure they are showing growth at each leveling period. If no growth is shown I use that data to give interventions and re level at the next progress measure.
2015-2017: Woods Reading Levels.xlsx
2017/2018: DRA Reading and Writing Composition Scores.xlsx
2018/2019: ~$2019 DRA Reading and Writing Composition Scores.xlsx
2019/2020- RTI and Reading Levels with Fontas and Pinnel as well as IXL
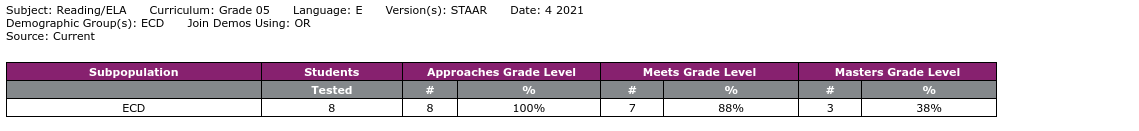
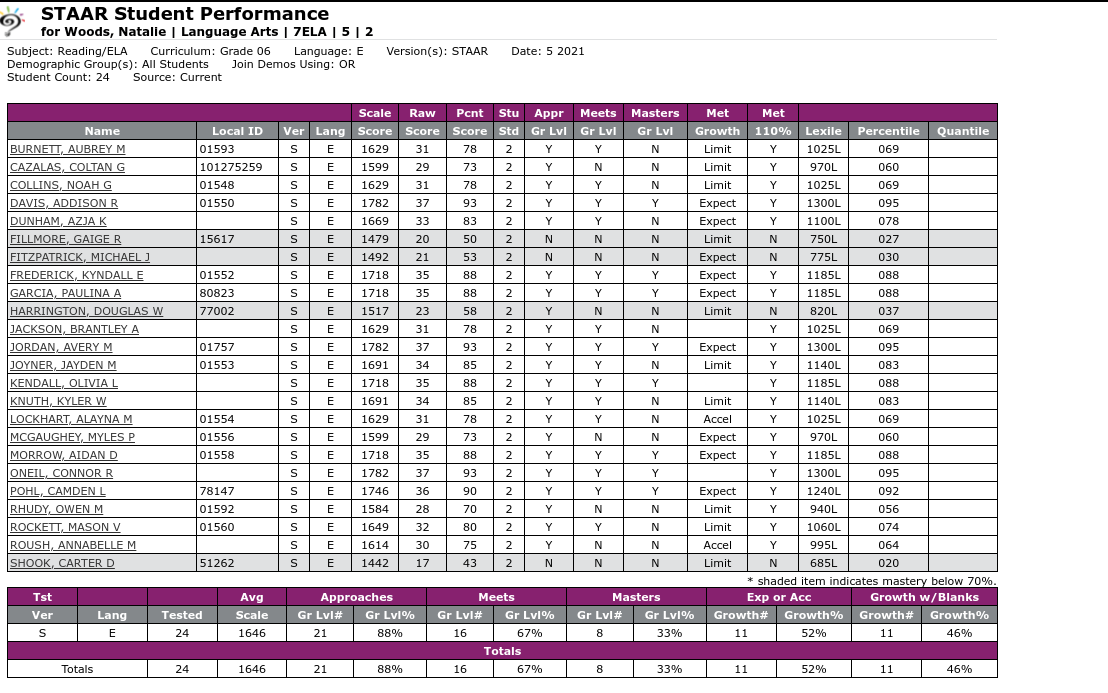
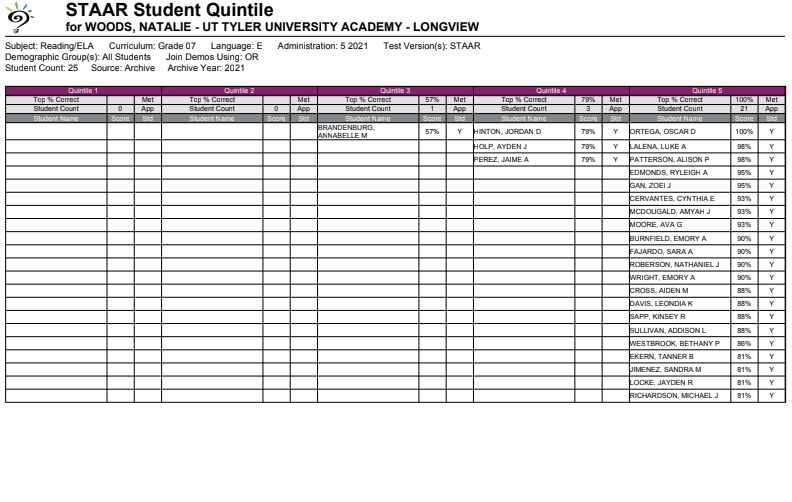
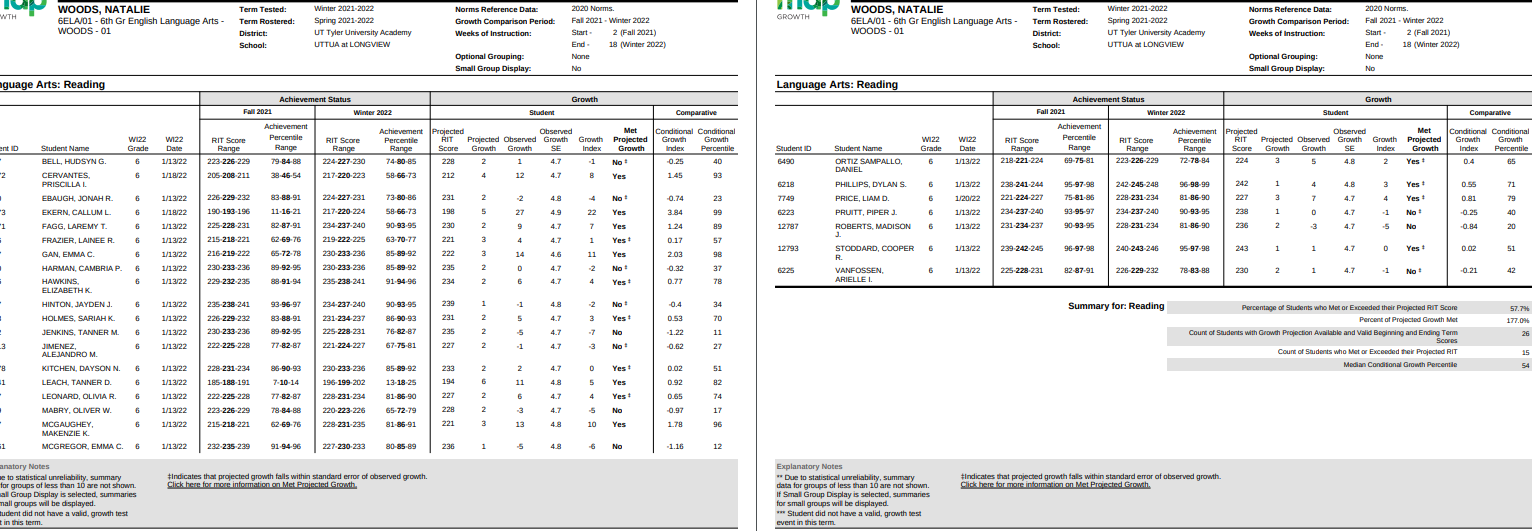
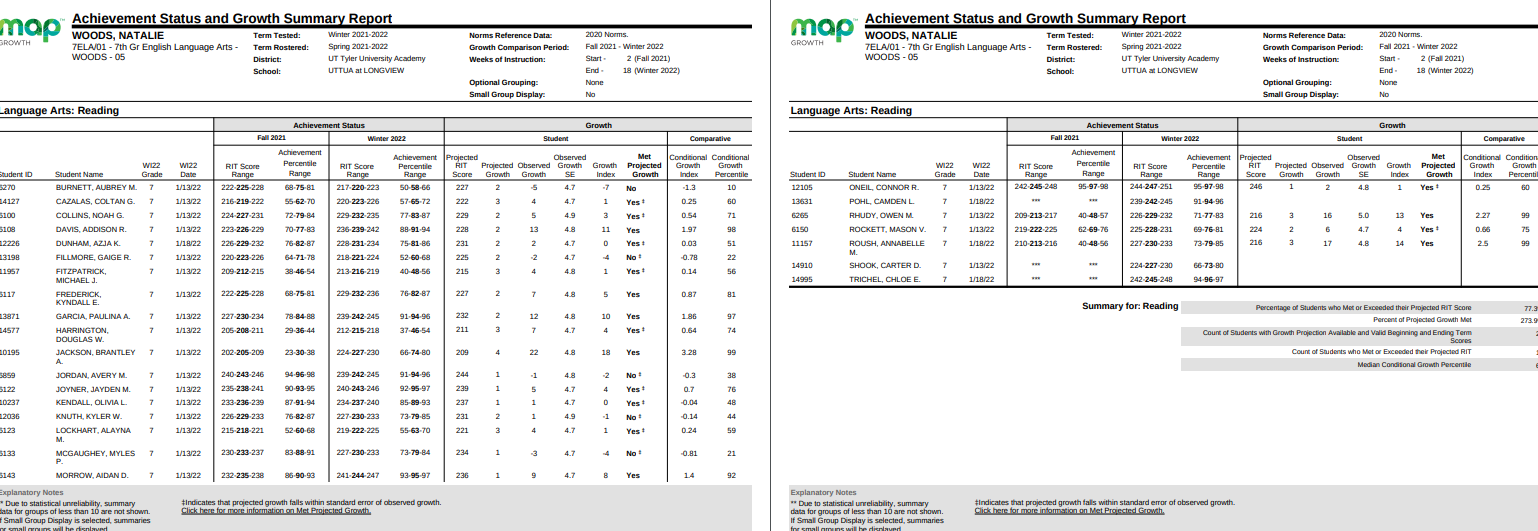
2020/2021 - Data Sheets were created with Dr. Woods and Samantha Rector to show measure Progress through previous STAAR Assessments, Benchmark, CDA and Post Summatives as well as using Lexia progress to help determine Teir 2 and 3 students.
5th Grade Data Sheet/Progress Measure 6th Grade Data Sheet/Progress Measure 7th Grade Data Sheet/Progress Measure
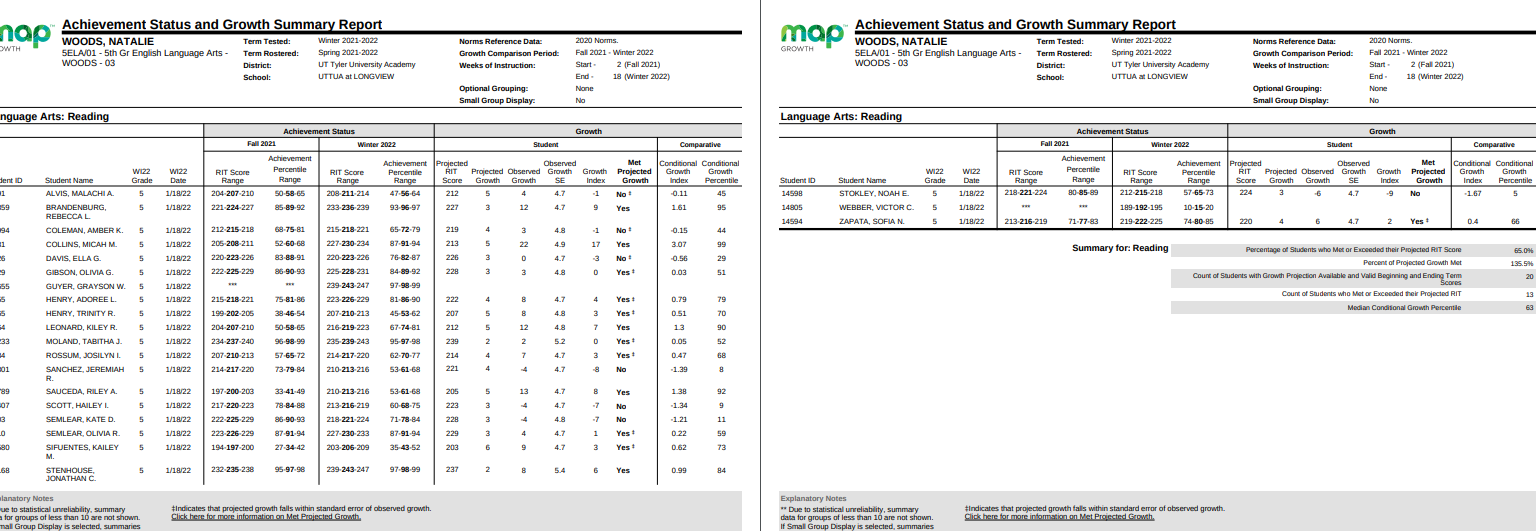
2021/2022 Data Sheets were created to measure Progress through Summative Assessments, CDA's Benchmarks and Maps Data. We used this data to determine Tier 1 and 2 students. I updated my data every 4 weeks to make sure Tier 2 students were making progress using Lexia units.
5th Grade Data Sheet/Progress Measure 6th Grade Data Sheet/Progress Measure 7th Grade Data Sheet/Progress Measure
Summative Data to Drive Instruction
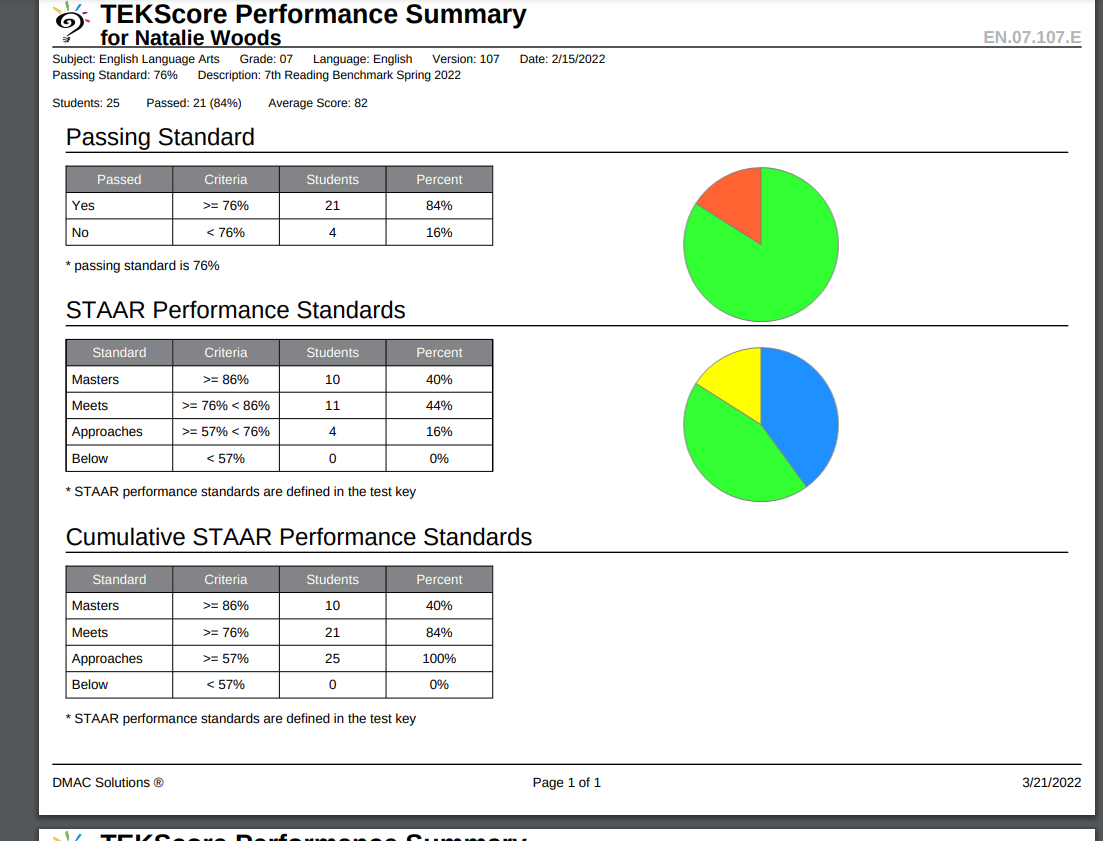
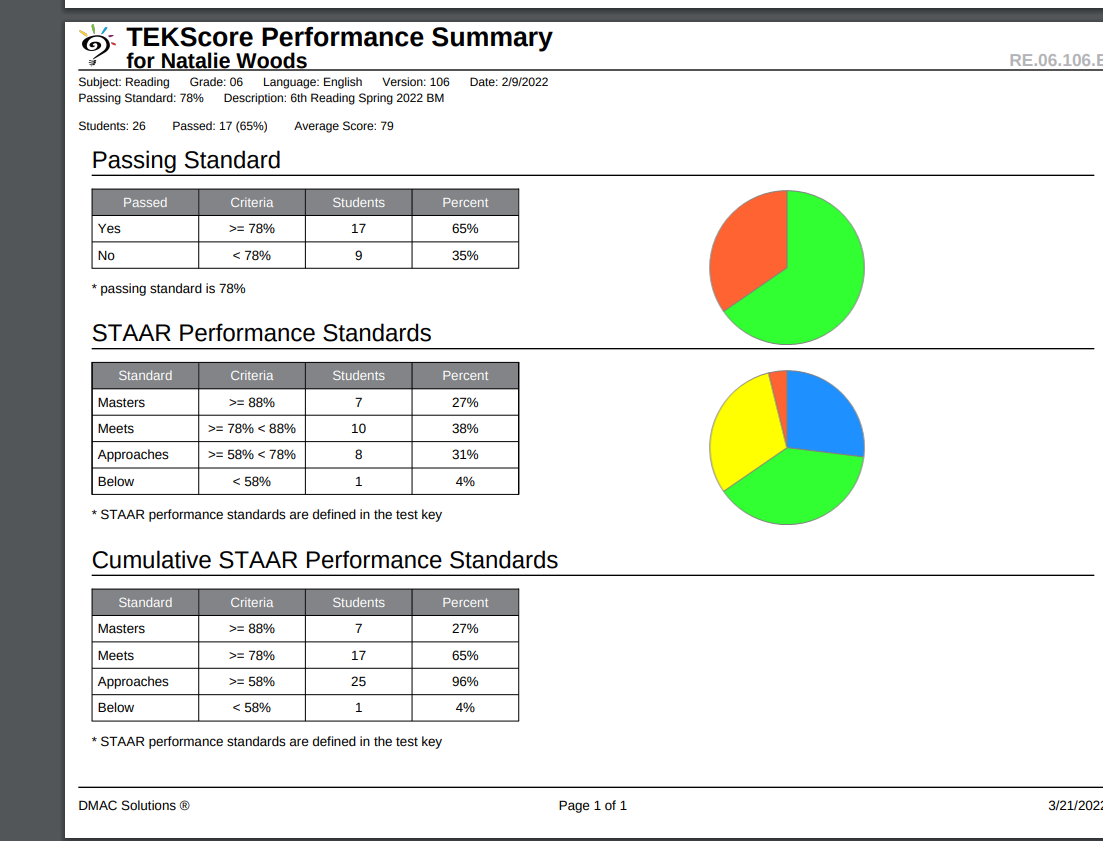
DMAC Summative Data
This year I started creating assessments through DMAC to be able to build better reports to drive instruction. I am able to build accomodations within the system to give students the accomdations they require. I pulled reports for the students to add to their Data trackers so they wer able to analyze their data and see their strenghs and weaknesses.

Personalized Learning and Data Trackers
This year with our new Personalized/Blended Learning Grant I tried some new avenues to encourage students to take ownership in their learning. I implemented this most with Summative Data including Benchmarks and CDA's. After a Benchmark, students would take a DMAC report that I would give them an analyze their lowest scoring skills. They would find which ones they struggle with the most and write them down on their Data Tracker. Once they have the TEK number they would match it to the Choice Board I created that would not only have the TEK number but they name of the skill, so they would have a better understanding on what they are actually struggling with. They could see on their Data Trackers how they are progressing from Benchmark to Benchmark. Once they have located the SIX skills ont the Choice Board the link would take them to a slide with a spcecfic activity to help them practice that skill. To show proof of completion each student would create and Artifact Google Slide that consists of screenshots of work or scores to show they had done the activities. This would be turned in to hold them accountable for their work. Below are some examples.
7th Writing Personalized Learning Choice Board
6th ELA Benchmark Choice Board
Student Artificat: 7th Grade Writing Student Slide Deck
BLENDED LEARNING PATHWAYS based from Benchmark Data -Online Learning
I created individualized learning paths based off of skills students struggles with on Benchmarks. I created review lessons for each skill on the benchmark assessment. Then I created individual Google Slides that had each TEK posted below 8o percent. The student then needed to find the skill that was linked in my Google site and complete that skill. They were to provide a finished screenshot from that skill and link it into the Google slide that was created for them. Once they finished they had a completed Google Slide with proof and evidence of each struggling skill. Students that preformed high on the Benchmark that did not have many skills they needed to practice recieved a reserach extension over an autobigraphy in providing practice with research and expository writing as well as learning about significant people in our past.
Blended Learning Skills organized by TEK #
Higher level Pathway with Extension
|
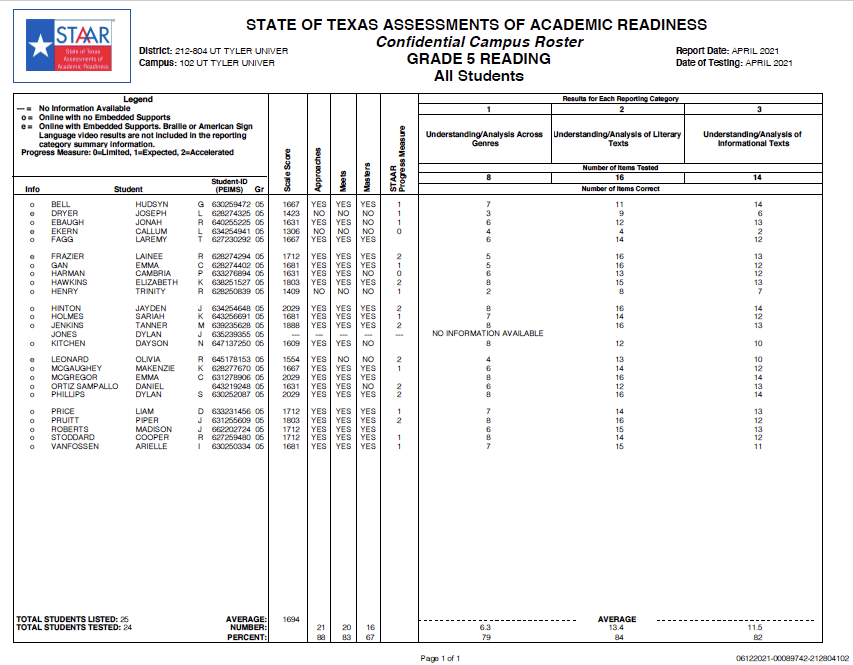
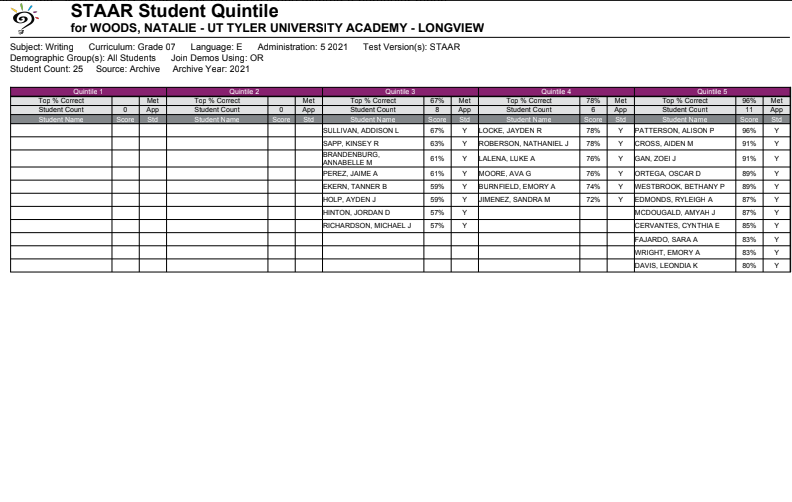
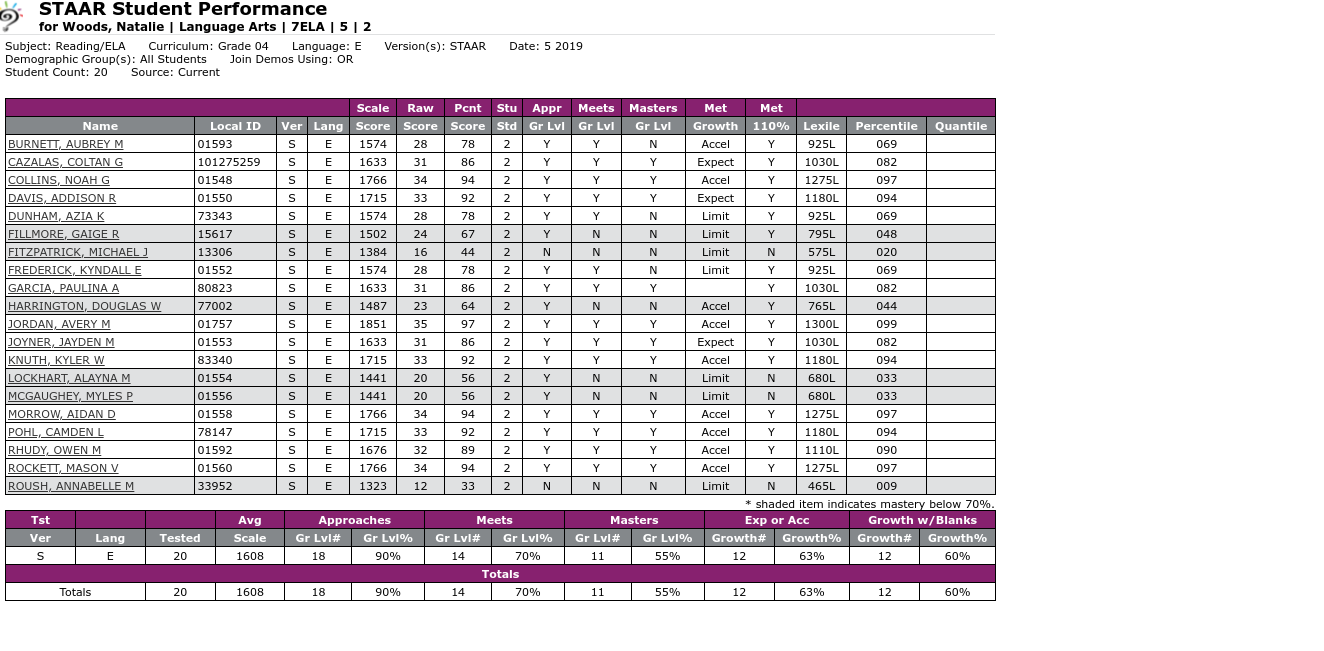
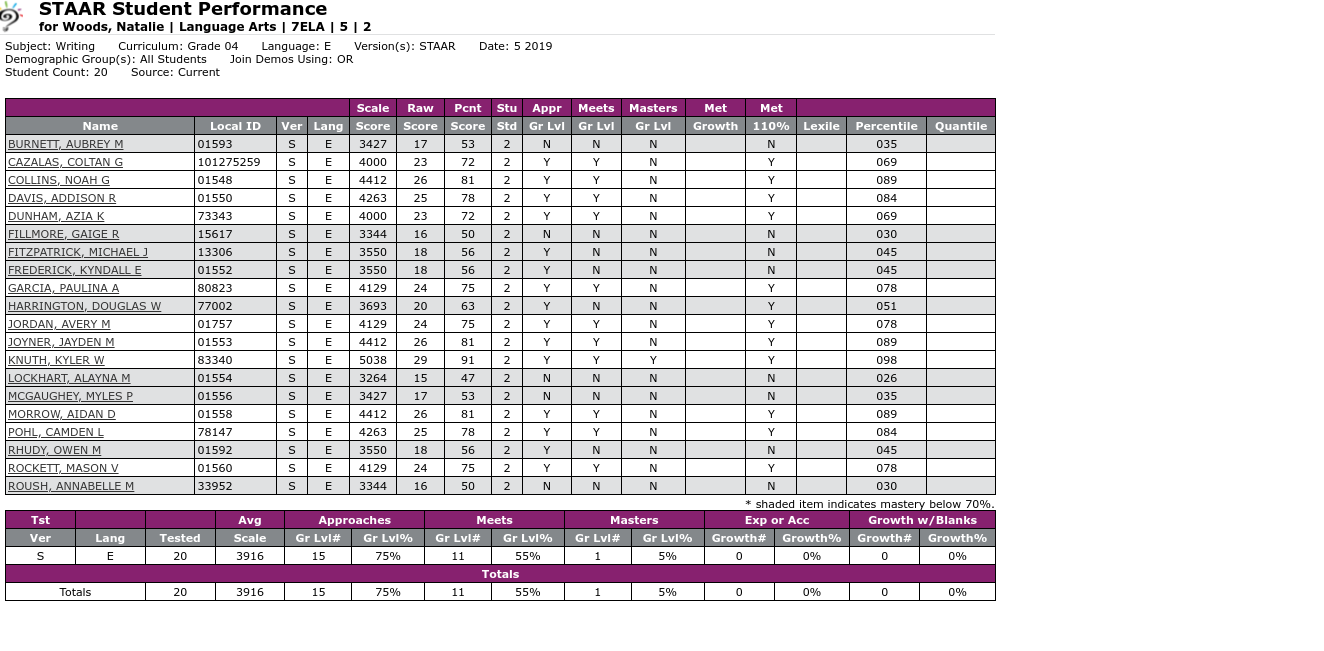
STAAR SCORES INDEX 1, 2 and 3
|